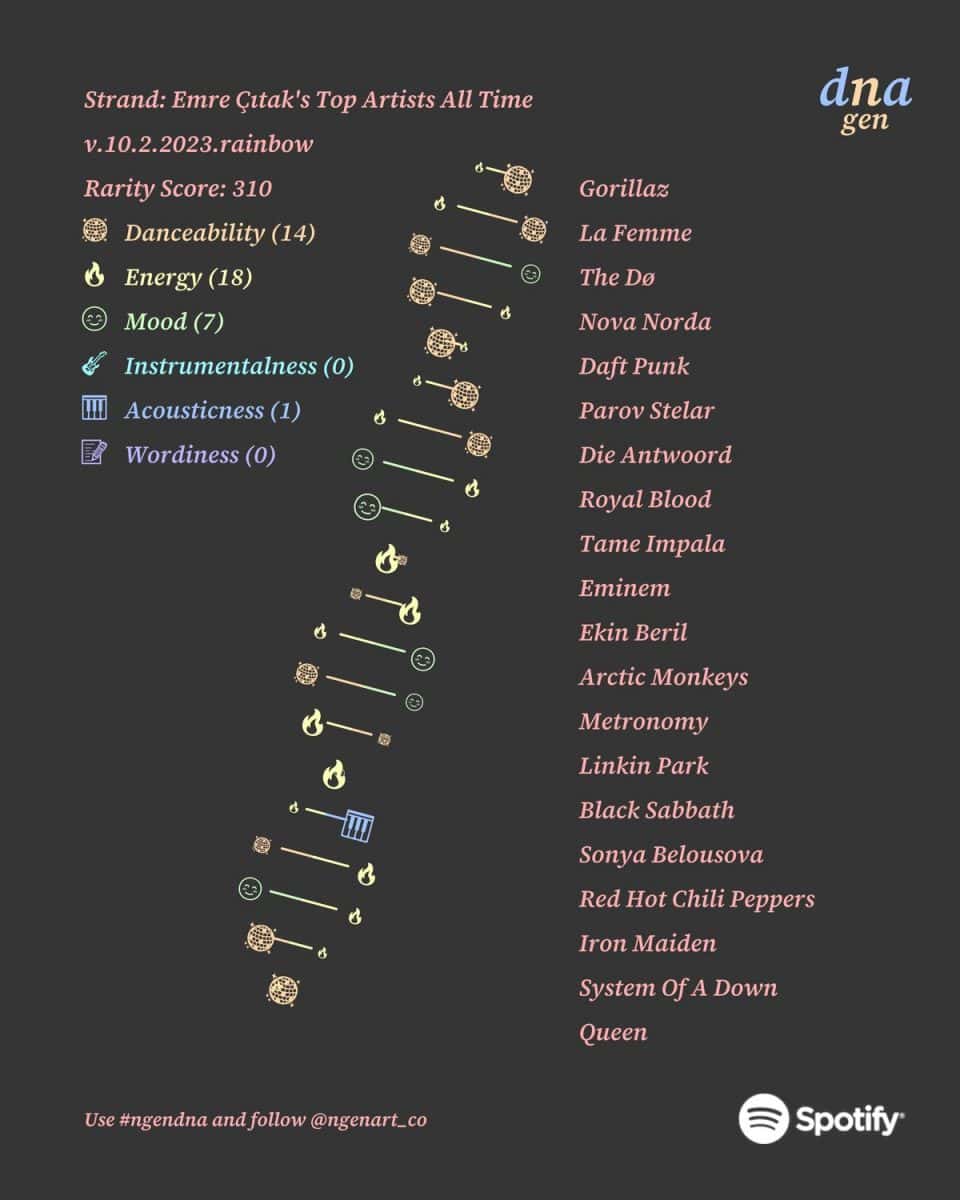
Viral Spotify 3rd party site n-gen Art is back with the Spotify DNA chart and this time it turns your listening habits into a DNA helix!
n-gen, the innovative viral art generator, has just taken its capabilities to the next level with the introduction of a Spotify DNA chart feature. This exciting update allows users to see how their musical tastes have evolved over time, and how their preferred artists and genres have shifted.
By utilizing data from their Spotify accounts, listeners can now generate unique and dynamic artwork that reflects their individualized listening habits.
What is Spotify DNA chart?
The Spotify DNA chart joins n-GEN's existing suite of creative tools, which already include features such as generating art from your favorite playlists and analyzing your listening habits to create personalized masterpieces. With this latest enhancement, the platform offers an unparalleled level of customization and insight into users' music preferences.
According to the website, the Spotify DNA chart is designed to provide users with a visual representation of their listening history, showcasing how their tastes have transformed over time. Whether you're a music gourmet or simply someone who loves discovering new tunes, this feature promises to be both entertaining and enlightening.

How to get your Spotify DNA chart
The innovative viral art generator has just launched a new feature that allows you to generate a unique DNA chart based on your Spotify listening habits. Here is how to get your Spotify DNA chart:
- Head over to ngenart.com/spotify/dna
- Click "Connect with Spotify"
- Login to your account and give n-GEN-art permission to view your Spotify data
- Choose the category or playlist you want to use for your DNA chart
- After selecting your category or playlist, scroll down further and click "Share card"
You may also customize the background of the Spotify DNA chart out of these preset backgrounds:
- Cereal
- Midnight
- Rainbow
- Frankenstein
- Fire
- Ice
- Banana
- Lavender
- Evergreen
- Strawberry
- Avocado
- Barbie
That's it! With these simple steps, you can uncover the unique musical makeup that defines your tastes and preferences.

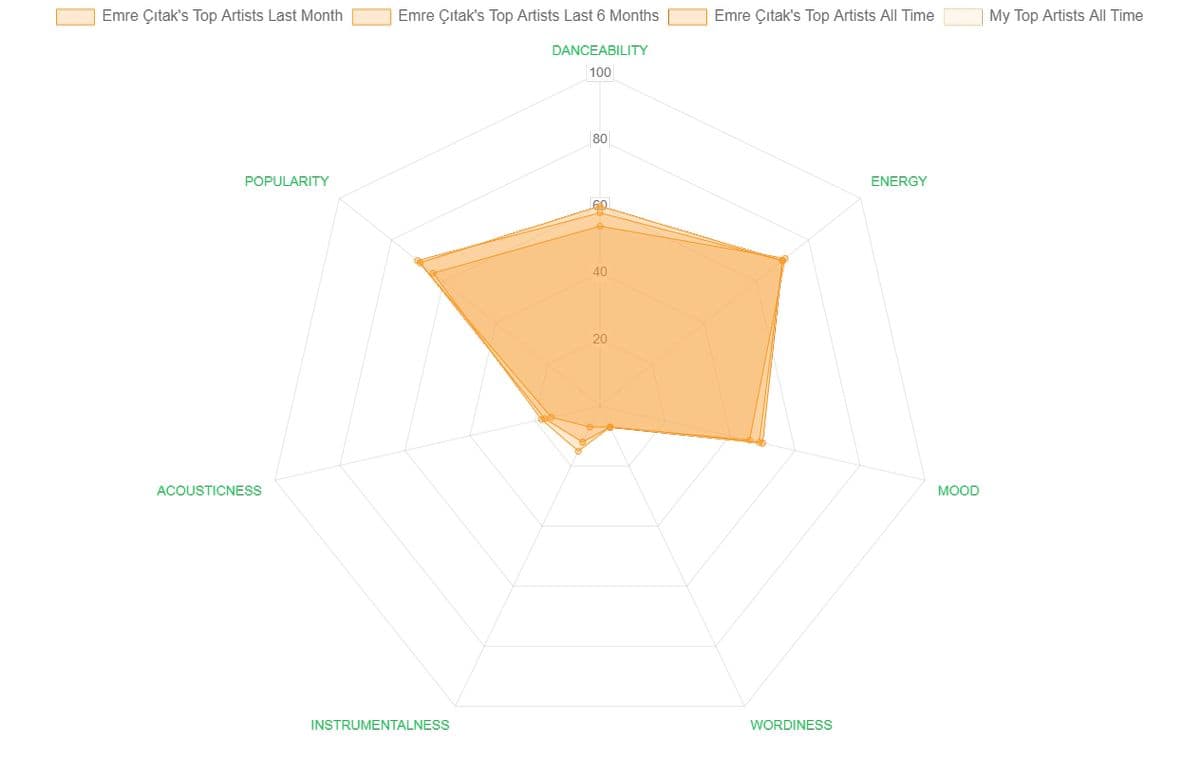
Then, for each song, n-GEN pulls six specific traits from Spotify's API: popularity, danceability, energy, mood, acousticness, and wordiness.
Here's what each trait means:
Popularity: This measures how well-known a song is, based on factors like the number of plays it has received and how recently those plays occurred. A popularity score of 100 indicates that the song is very well-known and has been played frequently, while a score of 0 suggests that the song is lesser-known.
Danceability: This describes how suitable a song is for dancing, based on factors like tempo, rhythm stability, beat strength, and overall regularity. A danceability score of 100 indicates that the song is very danceable, while a score of 0 suggests that it is not very danceable.
Energy: This measures how intense and active a song feels, based on factors like tempo, loudness, and noise level. An energy score of 100 indicates that the song feels very energetic, while a score of 0 suggests that it feels more mellow.
Mood: This measures the emotional tone of a song, based on factors like the melody, harmony, and lyrics. A mood score of 100 indicates that the song sounds very positive (e.g. happy, cheerful, euphoric), while a score of 0 suggests that it sounds more negative (e.g. sad, depressed, angry).
Acousticness: This measures how acoustic a song sounds, based on factors like the presence of acoustic instruments and the absence of electronic instruments. An acousticness score of 100 indicates that the song sounds very acoustic, while a score of 0 suggests that it sounds less acoustic.
Wordiness: This detects the presence of spoken words in a song. The more exclusively speech-like the recording (e.g. talk show, audio book, poetry), the closer to 100 the attribute value. Values above 66 describe tracks that are probably made entirely of spoken words. Values between 33 and 66 describe tracks that may contain both music and speech, either in sections or layered, including such cases as rap music. Values below 33 most likely represent music and other non-speech-like tracks.
Once n-GEN has analyzed your listening history and identified the songs you've listened to the most, it uses these six traits to create a unique visual representation of your musical tastes. The resulting chart shows your preferences for each trait, with different colors representing different levels of popularity, danceability, energy, mood, acousticness, and wordiness.

Not the DNA you were looking for?
Spotify has also joined forces with Ancestry.com to create a truly unique listening experience – playlists based on your DNA! By teaming up with the genealogy giant, Spotify aims to provide users with a sonic journey that reflects their family heritage.
Here's how it works: simply sign up for Ancestry.com's DNA testing service (which includes a one-time fee of $99) and trace your family tree. Once you have your results, input them into Spotify's playlist generator, and then you'll receive a personalized playlist tailored to your ancestral roots.
Thank you for being a Ghacks reader. The post How to get your Spotify DNA chart appeared first on gHacks Technology News.

0 Commentaires